Tag: stockmarket

  • 13 Must-Watch Financial Movies That Educate and Entertain

    13 Must-Watch Financial Movies That Educate and Entertain

    The world of finance has long been a source of fascination, drama, and intrigue. From stories of Wall Street excess to the dark side of corporate greed, financial movies offer both education and entertainment. Whether you’re an aspiring investor, an economics enthusiast, or simply looking for an engaging movie night, these 13 films are a must-watch.

    1. The Wolf of Wall Street (2013)

    THE WOLF OF THE WALL STREET

    Martin Scorsese’s high-octane biographical drama follows Jordan Belfort’s meteoric rise and dramatic fall on Wall Street. With Leonardo DiCaprio’s electrifying performance, this film is an exhilarating watch that showcases the temptations and dangers of financial success.

    2. The Big Short (2015)

    THE BIG SHORT

    This Oscar-winning film explains the 2008 financial crisis in an engaging and accessible way. With an ensemble cast, including Christian Bale, Steve Carell, and Ryan Gosling, it unpacks complex financial concepts with humor and sharp storytelling.

    3. American Psycho (2000)

    AMERICAN PYSCHO

    While not strictly a financial film, this psychological thriller highlights the materialism and superficiality of Wall Street culture through the chilling story of investment banker Patrick Bateman.

    4. Boiler Room (2000)

    BOILER ROOM COVER

    A gripping tale of young stockbrokers enticed by the allure of quick wealth, this film showcases the dark side of aggressive sales tactics and financial fraud.

    5. Margin Call (2011)

    MARGIN CALL COVER

    Set in a 24-hour period at a collapsing investment bank, this intense drama explores the behind-the-scenes decisions that led to the financial meltdown of 2008.

    6. Enron (2005)

    ENROLL COVER IMAGE

    This documentary unravels one of the biggest corporate frauds in history, exposing the deceptive practices that led to Enron’s downfall.

    7. Rogue Trader (1999)
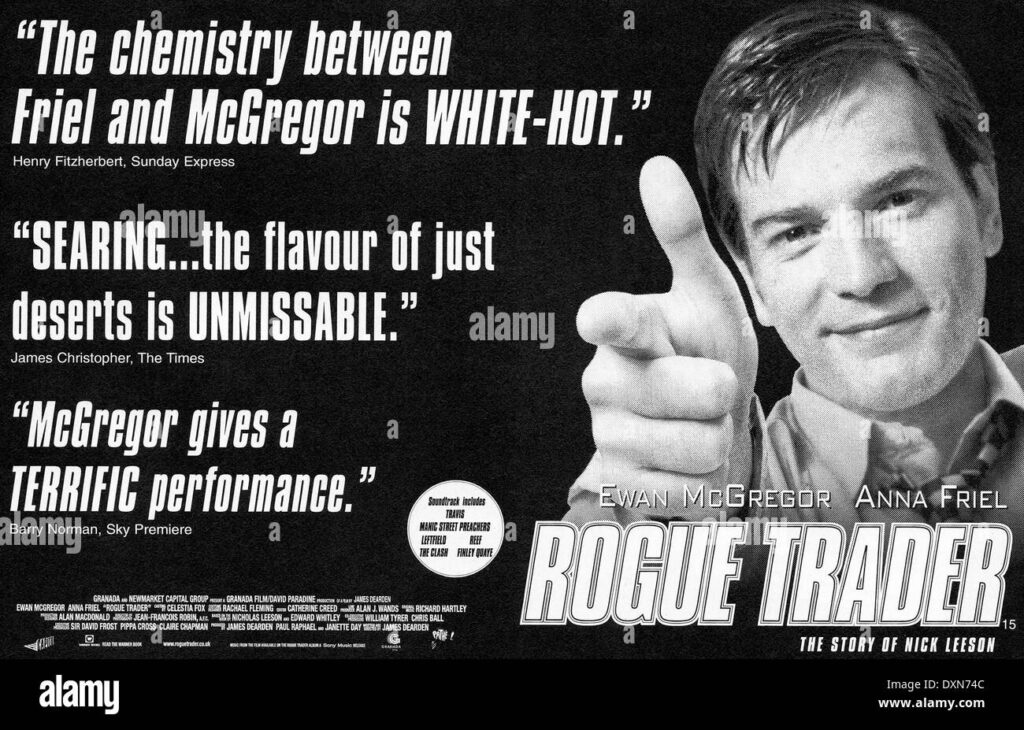
    ROGUE TRADER COVER

    Based on the true story of Nick Leeson, a trader whose reckless decisions led to the collapse of Barings Bank, this film is a cautionary tale about the dangers of unchecked risk-taking.

    8. Free Fall (2013 – Short Film)

    FREE FALL COVER IMAGE

    A lesser-known but powerful short film that explores the emotional and financial toll of an economic crash.

    9. Scam 1992:  Harshad Mehta Story (2020)

    SCAM 1992

    This critically acclaimed Indian web series chronicles the life of Harshad Mehta, the stock market manipulator behind one of India’s biggest financial scams.

    10. Inside Job (2010)

    INSIDE JOB COVER

    An Oscar-winning documentary narrated by Matt Damon, Inside Job provides an in-depth analysis of the 2008 financial crisis and the systemic corruption that led to it.

    11. Too Big to Fail (2011)

    TOO BIG TO FAIL COVER

    Based on real events, this film dramatizes the frantic efforts of government officials and financial leaders to prevent the global economy from collapsing in 2008.

    12. Wall Street (1987)

    WALL STREET COVER IMAGE

    Oliver Stone’s classic film, featuring the infamous character Gordon Gekko, remains one of the most iconic portrayals of Wall Street greed and ambition.

    13. Betting on Zero (2016)

    BETTING ON ZERO COVER IMAGE

    A compelling documentary that follows hedge fund manager Bill Ackman’s battle against Herbalife, a company accused of being a pyramid scheme.

    Honorable Mentions

    If you can’t get enough of financial dramas, consider checking out “Barbarians at the Gate” (1993), “The China Hustle” (2017), and “Equity” (2016). These films provide further insights into corporate greed, stock market manipulation, and high-stakes finance.

    Conclusion

    These movies offer a mix of real-life events, financial scandals, and fictional drama, making them both educational and highly engaging. Whether you’re looking to understand the complexities of the stock market, witness the rise and fall of financial empires, or simply enjoy a well-crafted story, these films have something for everyone.

    Which of these movies is your favorite? Let us know in the comments!

    Leave a Reply

    Your email address will not be published. Required fields are marked *

    TheHustleSpot

    BUSINESS IDEAS & SIDE HUSTLES

    Designed with WordPress

  • How To Use Sectorial Analysis For better Trades

    How To Use Sectorial Analysis For better Trades

    PART 6 – TECHNICAL ANALYSIS

    Sectoral analysis is the process of studying a specific industry or sector to understand its performance, trends, risks, and opportunities. Investors, entrepreneurs, and policymakers use this analysis to make informed decisions about business strategies, investments, and economic policies. It provides insights into market demand, competition, regulatory changes, and technological advancements within a sector.

    Sector Wise Analysis

    SECTOR ANALYSIS

    Weightage – If highly weightage stocks of any particular sector are high then nifty of that particular sector may go up, whereas if
    highly weightage stocks of any particular sector are down then nifty of that particular sector may also go down.
    There is a direct relationship between highly weightage stocks and sector of that particular stocks.
    For Example: it HINDCOPPER is going down than entire nifty metal may go down and vice – versa.

    NIFTY CORELATION

    Sector rotation is very important to understand the concept of sector support.

    All the sectors of nifty faces high and low They keep traveling, id one is high than other is low.
    Different sectors rotate around each other. The cycle keeps on moving around, if Nifty Metal is high at
    present then may be in future Nifty Metal may have a law. In the same way if Nifty Auto is low at present, then may be in near future Nifty Auto may have a high.

    We will not go opposite/against the sector. rather we always need sector in our support/favor.
    Hence, Sector support is one of the most important element while trading.

    NIFTY CHART
    SBI CHARTS

    When Nifty on 29 Feb 2016 comes down in the demand zone, similarly SBIN also come down in the demand zone, which means
    if NIFTY goes up, then SBIN also goes up as its already in the demand zone.

    This is how Sector and Stock support each other.

    HOW TO DO SECTOR ANALYSIS?
     Firstly, prepare a separate market watch with all the sectors of Nifty.
     Start from the Top-Down approach of the particular sector. From yearly to daily
     After the selection of stock, if stock is in zone and sector of that particular zone is also
    approaching towards its zone than the chances to react of that particular stock increases.
     Sector and Stock support each other in the movement.
    Booster Point :
    If any single timeframe of sector coincide with stock we can give 2 No.
    If get entry in both stock and its respective sector- we give 2 No.

    Stop Loss Trailing

    We do stop loss trailing when the price is on all time high and forming new demand zones.
    We shift our stop loss down to the distal line of newly formed demand zone and we will do this until it will get stop loss.

    TRAILING STOPLOSS

    Conclusion:

    Studying and understanding sectorial analysis is very important for executing best profitable trades , specially if you want to trade in indexes like Nifty50 & NiftyBank , and even Dow Jones. We have almost completed our study, if you want to master technical analysis keep trying , at least for two weeks try to mark the supply and demand zones and you can do paper trading.In future blogs I will also provide you some great demand & supply zones. These blogs are oly for educational purposes !!

    Stay tuned for more insights and business ideas !!

    PART – 7 TECHNICAL ANALYSIS

    PART – 5 TECHNICAL ANALYSIS

    TheHustleSpot

    BUSINESS IDEAS & SIDE HUSTLES

    Designed with WordPress

  • Gap Theory And Some Important Candlestick Patterns

    Gap Theory And Some Important Candlestick Patterns

    PART 5 – TECHNICAL ANALYSIS

    Candlestick Patterns

    1.BULLISH HARAMI : Signifies UP move

    BULLISH HARAMI

    First candle should be red and second candle should be green.

    Second candle body should be within the range of first candle
    body and wick should be within the range of wick

    2.BEARISH HARAMI : Signifies Down move

    BEARISH HARAMI

    First candle should be green and second candle
    should be Red.

    Second candle body should be within the range of first candle
    body and wick should be within the range of wick.

    3.BULLISH ENGULFING : Signifies UP move

    BULLISH ENGULFING

    First candle should be red and second candle should be green.

    Second candle body should be within the range of first candle
    body and wick should be within the range of wick.

    4.BEARISH ENGULFING : Signifies Down move

    BEARISH ENGULFING

    First candle should be green and second candle
    should be Red.

    Second candle body should be within the range of first candle
    body and wick should be within the range of wick.

    5.MORNING STAR : Signifies UP move

    MORNING STAR

    Green candle should close above half of the body of the red
    candle .
    For safer side we will consider this only when green candle
    should close above complete range of red candle so we
    can say we have a strong DBR structure.

    6.EVENING STAR : Signifies Down move

    EVENING STAR

    Red candle should close below half of the body of the green
    candle .
    For safer side we will consider this only when red candle
    should close below complete range of green candle so we
    can say we have a strong RBD structure.

    7.Hammer : Bullish pattern

    HAMMER
    1. Inverted Hammer : Bearish pattern
    INVERTED HAMMER

    9.Shooting Star : A Hammer at the end of down trend or an inverted hammer at the end of an up trend

    SHOOTING STAR

    GAP THEORY

    Real Gaps : The market truly closed and later on truly re-opened providing a difference in price (previous day close
    and next days open).
    Commodity market are prone to rollover gaps.

    Fake Gaps : Generally occurs as a result of mathematical calculation.
    These gaps occurs only in global market and do not occur in Indian Markets.

    Inside gap : If a gap occurs within the range of the previous candle, it is called as an Inside Gap.

    INSIDE GAP

    Outside gap : If a gap occurs outside the range of the previous candle, it is called as an Outside Gap

    OUTSIDE GAP

    Novice Gap : A gap in the same direction of the trend, it is called as a Novice GAP.

    NOVICE GAP

    Pro Gap : A gap in the opposite direction of the trend, it is called as a PRO GAP

    PRO GAP

    APPLICATION OF GAPS ( NOVICE & PRO GAP )

    APP 1. A novice gap into the zone makes that particular trade a high probability trade.

    GAP1

    APP 2. A novice gap into the a pro gap makes that particular trade a high probability trade.

    GAP2

    APP 3. A pro gap from the zone makes that particular trade a high probability trade

    GAP3

    ANOTHER IMPORTANT GAP

    Significant Gap : A gap that occurs beyond the range of previous candle is called as significant gap.

    Window Gap : A pro gap can also be a window gap.

    WINDOW GAP

    LOTL – ( LEVEL ON THE TOP OF THE LEVEL /

    LEVEL OVER THE LEVEL )

    Case 1:

    LOTL1

    Case 2:

    LOTL2

    Case 3:

    LOTL3

    TRAP LEVELS

    Bull Trap – These are supply zone where conventional technical analysis people will make
    novice buying mistake.

    BULL TRAP

    Bear Trap – These are demand zone where conventional technical analysis people will make
    novice selling mistake.

    BEAR TRAP

    Common Mistakes to Avoid

    1. Ignoring Trend Direction: Always trade with the trend to increase success probability.
    2. Using Indicators in Isolation: Combine multiple indicators to confirm signals.
    3. Overcomplicating Analysis: Too many indicators can create conflicting signals.
    4. Failing to Manage Risk: Always use stop-loss and proper risk-reward ratios.

    Stay tuned for more insights on advanced trading techniques in our upcoming blogs!

    PART – 6 TECHNICAL ANALYSIS

    PART – 4 TECHNICAL ANALYSIS

    TheHustleSpot

    BUSINESS IDEAS & SIDE HUSTLES

    Designed with WordPress

  • How to Use Moving Averages & Indicators for Better Trades

    How to Use Moving Averages & Indicators for Better Trades

    PART 4 – TECHNICAL ANALYSIS

    Technical indicators play a crucial role in trading by providing insights into price trends, momentum, and potential reversal points. Moving Averages and oscillators like the Relative Strength Index (RSI) and Stochastic Indicator are some of the most widely used tools by traders. This blog will explore how to effectively use these indicators based on insights from professional trading methodologies.

    Type of Movig Averages

    1. Simple Moving Average (SMA):
    • Calculates the average price over a fixed amount of time.
    • Reacts slower to price changes, making it useful for identifying long-term trends.
    1. Exponential Moving Average (EMA):
    • Gives more importance to recent prices, making it more responsive to market fluctuations.
    • Often used by short-term traders for faster trend identification.

    Application of Exponential Moving Average
    Golden Cross over : If lower moving average cuts higher moving average in upside
    then it is called as a golden crosss over.
    Death Cross over : If lower moving average cuts higher moving average in downside
    then it is called as a death crosss over.

    IMPORTANT POINTS

    1. MOVING AVERAGE WORKS PERFECTLY ONLY IN TRENDING MARKET .
    2. WE WILL LOOK FOR THE SETUP AS USUAL, WE ARE ONLY GOING TO USE (EMA) AS
      AN ADDED TRADE SCORE .
    3. IF MOVING AVERAGE TRADING THROUGH THE ZONE (20 EMA OR 50 EMA) THAN WE CAN
      GIVE ADDITIONAL TRADE SCORE (1).
    • MOVING AVERAGE SHOULD BE APPLY ON EXECUTION TIME FRAME ONLY.
    • GOLDEN CROSS OVER IS FOR DEMAND ZONE (BULLISH).
    • DEATH CROSS OVER IS FOR SUPPLY ZONE (BEARISH) .

    Important Concepts in Moving Averages

    • Golden Cross: Occurs when a lower moving average (e.g., 20 EMA) crosses above a higher moving average (e.g., 50 EMA), signaling a bullish trend.
    • Death Cross: Occurs when a lower moving average crosses below a higher moving average, indicating a bearish trend.
    • Moving Average in Trend Markets: Moving averages work best in trending markets, and they should not be solely relied upon in sideways markets.
    • EMA as Trade Score Factor: If a moving average (20 EMA or 50 EMA) aligns with a demand or supply zone, it can add an additional trade score【85:5†source】.

    RSI: Measuring Market Momentum

    The Relative Strength Index (RSI) is a momentum checker that measures the speed and change of price movements.

    RSI Levels:

    • Above 70: Overbought conditions, potential for a price pullback.
    • Below 30: Oversold situations, potential for a price reversal upward for buying.
    • 50 Level: Acts as a neutral zone; a breakout above or below may indicate trend continuation.

    How to Use RSI Effectively

    • Positive Divergence: If price makes lower lows but RSI forms higher lows, it indicates a potential bullish reversal.
    • Negative Divergence: If price makes higher highs but RSI forms lower highs, it suggests a bearish reversal.
    • RSI with Demand & Supply Zones: If the price reaches a demand zone while RSI is in oversold territory, it strengthens the probability of a bullish move【85:1†source】.

    Stochastic Indicator: Identifying Reversals

    The Stochastic Oscillator measures the closing price relative to a price range over a given period.

    Stochastic Levels:

    • Above 80: Overbought zone, potential price drop.
    • Below 20: Oversold zone, possible price increase.

    Trading with Stochastic Indicator

    • When the %K line crosses above the %D line in the oversold zone, it indicates a buy signal.
    • When the %K line crosses below the %D line in the overbought zone, it signals a sell opportunity.
    • Combining Stochastic with support/resistance zones can enhance trade accuracy【85:0†source】.

    Combining Indicators for Stronger Signals

    Using a single indicator is not always reliable. Combining multiple indicators can improve trade accuracy.

    Example Trading Setup:

    1. Check the trend using moving averages (Golden Cross for uptrend when both the indicators crosses each other, Death Cross for downtrend).
    2. Use RSI to check whether the stock or the commodity is overbought or oversold.
    3. Confirm entry with Stochastic crossovers.
    4. Place stop-loss orders near recent support or resistance levels.

    Advanced Trend Analysis

    TREND ANALYSIS

    A. IF ONE DEMAND ZONE BREACHED THEN TREND WILL BE SIDEWAYS AND IF TWO DEMAND ZONE BREACHED TREND WILL BE
    DOWN.
    B. IF ONE SUPPLY ZONE BREACHED THEN TREND WILL BE SIDEWAYS AND IF TWO SUPPLY ZONE BREACHED TREND WILL BE UP.

    Common Mistakes to Avoid

    1. Ignoring Trend Direction: Always trade with the trend to increase success probability.
    2. Using Indicators in Isolation: Combine multiple indicators to confirm signals.
    3. Overcomplicating Analysis: Too many indicators can create conflicting signals.
    4. Failing to Manage Risk: Always use stop-loss and proper risk-reward ratios.

    Conclusion

    Moving Averages, RSI, and Stochastic Indicator provide traders with valuable insights into market behavior. By combining these indicators and using them strategically, traders can increase their chances of making profitable decisions. Understanding how to interpret their signals and avoiding common mistakes will further enhance trading success.

    Stay tuned for more trading strategies and market insights in upcoming blogs!

    PART – 5 TECHNICAL ANALYSIS

    PART – 3 TECHNICAL ANALYSIS

    TheHustleSpot

    BUSINESS IDEAS & SIDE HUSTLES

    Designed with WordPress

    Leave a Reply

    Your email address will not be published. Required fields are marked *

  • Mastering Risk Management in Trading: The Key to Long-Term Success

    Mastering Risk Management in Trading: The Key to Long-Term Success

    PART 3 – TECHNICAL ANALYSIS

    Risk management is an essential skill that every trader must master to ensure long-term profitability and capital preservation. Without proper risk management, even the best trading strategies can lead to significant losses. In this blog, we will explore crucial risk management techniques derived from professional trading methodologies.

    Trading on Different Time Frames

    TIME FRAMES

    Curve Analysis

    • It is also known as location analysis.
    • What is location???
    • Location gives you an idea about how high or how low you are on theprice curve.

    CAUTION :

    1. If you are buying on a strong daily demand but you are near weeklysupply, Chances are very high that your
      will get stopped out.
    2. If you are selling on strong 15 min supply, but you are near to daily demand, chances are very high that your
      trade will getstopped out.

    Steps in Identifying location on a price chart

    1. Mark Nearest fresh supply zone & nearest fresh Demand zone.
    2. Divide this area between supply and demand into 3 parts by using
      retracement tool, start it from proximal line of a supply to proximal line of a demand.
    PRICE CHART LOCATION

    RULES :

    1. If CMP( Current market price) is trading high on the curve or very high onthe curve.
      Action – SELL ( at execution time frame )
    2. If CMP( Current market price) is trading low on the curve or very low onthe curve.
      Action – BUY ( at execution time frame )
    3. If CMP( Current market price) is trading in an equilibrium area
      Action – will go to trending time frame and check the trend and will plantrade according to the trend.
      At Intermediate Time Frame
    • Trend Up – BUY
    • Trend Down – SELL
    • Trend Sideways – IGNORE
      Note –
      1.If there is no fresh supply but fresh demand – Assume that stock is trading in the equilibrium and trade with
      the trend.
      2.If there is no fresh demand but fresh supply – Assume that stock is trading in the equilibrium and trade with
      the trend.

    Understanding Risk Per Trade

    One of the first steps in risk management is determining how much capital to risk per trade. Based on professional guidelines:

    • 1% Risk – Suitable for beginners
    • 1.5% Risk – Ideal for intermediate traders
    • 2% Risk – Used by pro traders

    For example, if a trader has a capital of ₹1,00,000 and follows a 1% risk rule, they should not risk more than ₹1,000 per trade. This limits potential losses and allows room for recovery from drawdowns.

    RISK MANAGEMENT

    Position Sizing Formula

    The right position sizing ensures that traders do not over-leverage their capital. The formula to calculate quantity per trade is:

    QTY = Risk per Trade / (Entry Price – Stop Loss Price)

    For instance, if the stop-loss distance is ₹10 and the risk per trade is ₹1,000, the position size should be 100 shares.

    Risk-to-Reward Ratio

    Successful traders ensure that their potential rewards outweigh their risks. The recommended risk-to-reward ratios are:

    • 1:2 – A balanced risk-reward setup
    • 1:3 – Ideal for sustainable trading
    • 1:5 – High-probability trades

    If a trader risks ₹1,000, they should aim for a profit of at least ₹2,000 with a 1:2 risk-reward ratio.

    Trade Score

    A trade’s strength is determined by its score. A minimum trade score of 5 is required for an entry, while a score of 7 or higher is considered ideal.

    Components of a Trade Score:

    • Freshness
    • If a level is fresh: 3 points
    • If tested once: 1.5 points
    • If tested twice: 0 points
    • Strength
    • If price leaves the level with a gap: 2 points
    • If price leaves the level with two exciting candles: 2 points
    • If price leaves the level with only one exciting candle and no gap: 1 point
    • Time at the Base
    • If the base has 1-3 boring candles: 2 points
    • If the base has 4-5 boring candles: 1 point
    • If the base has more than 5 boring candles: 0 points
    TRADE SCORE

    Entry and Exit Strategies

    There are three types of entries based on credibility and trade confirmation:

    1. Set & Forget (Trade Score 7+) – Entry is placed with predefined stop-loss and target, requiring minimal monitoring.
      Image: pdf pg20
    2. Confirmed Entry (Trade Score 5-6) – Entry is made only after price action confirms the trade setup.
      Image: pdf pg20
    3. Aggressive Entry (Trade Score 5+) – Entry is made in anticipation of price action without full confirmation.
      Image: pdf pg21 & 22 Multiple cases n multiple images

    Exit Strategies

    • Target-based exit – Predefined profit target is reached.
    • Trailing Stop-Loss – Exit trade as price moves against the trend.
    • Break-even Exit – Move stop-loss to entry point when price moves favorably.

    Common Trading Mistakes to Avoid

    1. Overtrading – Taking excessive trades without proper setups.
    2. Ignoring Stop-Loss – Not using stop-loss increases risk exposure.
    3. Poor Position Sizing – Trading too large can wipe out capital quickly.
    4. Emotional Trading – Letting fear and greed dictate decisions.
    5. Lack of Trade Review – Not analyzing past trades prevents learning.

    Conclusion

    Risk management is the backbone of successful trading. By implementing proper risk-reward ratios, position sizing, stop-loss strategies, and disciplined trade execution, traders can achieve consistent profitability. Follow these principles and refine your approach to master risk management and thrive in the markets.

    Stay tuned for more insights into professional trading strategies!

    PART – 4 TECHNICAL ANALYSIS

    PART – 2 TECHNICAL ANALYSIS

    TheHustleSpot

    BUSINESS IDEAS & SIDE HUSTLES

    Designed with WordPress

  • Understanding Demand & Supply Zones for Smart Trading Decisions

    Understanding Demand & Supply Zones for Smart Trading Decisions

    Part 2 – TECHNICAL ANALYSIS

    The financial markets operate on a fundamental principle: the balance between demand and supply. Traders who can identify demand and supply zones effectively gain a crucial edge in predicting price movements and making informed decisions. This blog will guide you through the key concepts of demand and supply zones and how to use them in your trading strategy.

    What Are Demand & Supply Zones?

    Demand and supply zones are price areas where strong buying (demand) or selling (supply) activity occurs, leading to potential reversals or breakouts. These zones play a crucial role in identifying strategic entry and exit points for traders.

    Demand Zone (DZ): A price area where buying interest is significantly strong, causing prices to rise. This is often seen after a downtrend when buyers step in to push the price higher.

    Supply Zone (SZ): A price area where selling pressure is dominant, pushing prices downward. This occurs at resistance levels where sellers enter the market aggressively.

    These zones are created by institutional traders, banks, and large market participants who place bulk orders at specific price levels. Basically these zones have bulk pending orders, which are picked up when the price comes in these zones.
    Identifying these zones accurately can give traders an edge over the market by helping them avoid low-probability trades.

    1. Demand Zone Characteristics:

    • Found at the bottom of a downtrend.
    • Characterized by strong bullish candles moving away from the zone.
    • Multiple retests of the zone indicate its strength.
    • Often associated with high trading volume, showing increased buying interest.

    2. Supply Zone Characteristics:

    • Located at the top of an uptrend.
    • Marked by strong bearish candles moving away from the zone.
    • More touches strengthen the zone’s credibility.
    • Typically, price rejects these zones rapidly due to significant selling pressure.

    Types of Demand Zone:

    1.- Drop-Base-Rally (DBR): A price drop followed by consolidation and then a strong rally. This indicates that buyers have accumulated orders in the base before pushing prices higher.

    2.Rally-Base-Rally (RBR): A bullish continuation pattern where price pauses momentarily before continuing its upward movement.

    TYPES OF DEMAND ZONES

    Types of Supply Zone:

    Rally-Base-Drop (RBD): A price increase, brief consolidation, and then a sharp drop. This signifies that sellers have taken control after a short consolidation phase.

    Drop-Base-Drop (DBD): A bearish continuation pattern where price consolidates before dropping further.

    TYPES OF SUPPLY ZONE

    Zone Marking

    1. Demand zone While Marking the Demand Zone Higher Body of all base and Lower Wick of all base
      is consider
    • Line Marked at the Body (Higher)
      of the base is called Proximal Line.
    • Line Marked at the Wick (Lower)
      of the base is called Distal Line.
    ZONE MARKING
    ZONE MARKING
    1. Supply Zone

    While Marking the Supply Zone Lower Body of all base and Higher Wick of all base is
    consider.

    • Line Marked at the Body (Lower)
      of the base is called Proximal Line.
    • Line Marked at the Wick (Higher)
      of the base is called Distal Line.

    Steps of marking Demand Zones :

    Identification & Marking of Demand Zone

    1. Mark a horizontal line at current market price
    2. Look left & down for an explosive upmove (green exciting candle)
    3. Mark legin base legout.

    Now we have 2 ways of marking –

    PROXIMAL, DISTAL LINES

    Initially we will focus on body to wick

    Identification & Marking of Supply Zone

    1.Mark a horizontal line at current market price.

    1. Look left & up for an explosive drop (red exciting candle)
    2. Mark legin base legout.

    Now we have 2 ways of marking

    PROXIMAL & DISTAL LINES

    Important point :

    • In demand zone legout will be green while in supply zone legout will be red .
    • Legin may be either green or red depending on pattern.

    Booster point :

    Legout should be explosive, so we can say we have enough pending order on the base and our zone is powerful.

    Trade Setup

    After marking demand zone or a supply zone the trade setup needs to be marked as under :

    ENTRY

    1. After marking the Demand Zone, entry point is to be marked just above the proximal line.
    2. After marking the Supply Zone, entry point is to be marked just below the proximal line.

    STOP LOSS
    Stop Loss should be just below the distal line of the demand zone and just above the distal line of the supply zone.

    TARGET:
    Target to be marked which is equivalent to the double of the difference between Entry point and Stop Loss (2:1) and make sure
    our trade setup should permit this.

    TRADE SETUP

    In the above example, Entry is marked at Rs. 125/- Stop Loss is marked as Rs. 120/- and the Target is marked at Rs. 135/-.

    How to Use Demand & Supply Zones in Trading

    1. Entry & Exit Strategies
    • Buy at Demand Zones: Enter long positions when the price approaches a strong demand zone and shows confirmation signals like bullish candlestick formations (e.g., hammer, engulfing pattern).
    • Sell at Supply Zones: Enter short positions when the price reaches a supply zone and shows reversal signals like bearish engulfing candles or shooting stars.

    2. Stop Loss Placement

    • Place stop losses slightly below the demand zone for buy trades to protect against false breakouts.
    • Place stop losses slightly above the supply zone for sell trades to ensure minimal losses if the price moves against your position.

    3. Confirmation with Other Indicators

    • Use Volume Analysis to check participation at the zone. A high volume spike near a demand zone suggests strong buying interest.
    • Use RSI & MACD to confirm overbought or oversold conditions and identify potential reversals.
    • Combine with trendlines & moving averages for added accuracy. For example, if a demand zone aligns with a 200-day moving average, it strengthens the probability of a bounce.

    CANDLE BREAK DOWN AND MARKET PSYCHOLOGY

    MARKET PYSCHOLOGY

    Note – We should use zone with minimum base candle. If we are considering multiple base candle
    zone, make sure we should have a strong legout candle.

    Price Origin and Closing Concepts

    Price origin :

    PRICE ORIGIN & CLOSING CONCEPTS

    Closing Concepts :

    CLOSING CONCEPTS

    Another Formation of exciting candle :

    EXCITING CANDLES
    EXCITING CANDLES

    Distribution Of Buying

    DISTRIBUTION OF BUYING

    Analyzing Trends

    1. Zones help us to decide whether to be a buyer or seller. However, trend will help us to decide whether go long in
      thedemand or sell short in the supply.
    • You should be buyer at demand ifstock isin Uptrend.
    • You should seller atsupply ifstock isin Downtrend.

    How to look at Trend

    1. Add 50 SMA on your price chart.
    2. Starting from the current candle calculate 7 days(candles)backwards.
    3. Draw vertical line on the seventh candle.
    4. The point where your vertical line isintersecting the 50 sma, drawa horizontal line.
    5. Just imagine clock with 12-3-6

    The Rule is :

    1. If your moving average istrading between 12-3 and color of themoving average is green then trend is UP.
    2. If your moving average istrading between 3-6 and color of themoving average is red Then trend is DOWN.
    3. If your moving average is trading close to 3 and color of the movingaverage is red or green then trend is Sideways.

    Caution:-
    Buying at demand when stock is in downtrend and selling at supply when stock is in uptrend can be extremely dangerous.

    Mistakes to Avoid When Trading Demand & Supply Zones

    1. Ignoring Market Context: Always check the overall trend before taking trades. Trading against a strong trend can lead to losses even if the zone appears strong.
    2. Entering Without Confirmation: Look for reversal candlestick patterns before executing trades. Avoid impulsive trades without clear validation.
    3. Not Managing Risk Properly: Always use a stop-loss to protect your capital. A well-placed stop-loss ensures that losses are minimized in case the market moves unfavorably.
    4. Misidentifying Strong Zones: Weak zones can lead to false breakouts and losses. Always prioritize zones with strong price action and volume confirmation.
    5. Overtrading: Just because a demand or supply zone exists doesn’t mean it must be traded. Wait for the best setups to maintain high win rates.

    Advanced Techniques for Demand & Supply Trading

    1. Trend Confirmation:
    • If a demand zone aligns with an uptrend, it increases the likelihood of a successful trade.
    • If a supply zone forms during a strong downtrend, it adds confluence to a potential short position.

    2. Scaling In & Out:

    • Instead of entering a trade with full capital, consider scaling into positions near demand zones and scaling out near supply zones.

    3. Identifying Institutional Orders:

    • Institutional traders leave clues in the form of large volume spikes at demand and supply zones. Recognizing these patterns can provide insight into smart money activity.

    Conclusion

    Understanding demand and supply zones is essential for successful trading. When used correctly, these zones provide high-probability trade setups and help in risk management. By combining them with technical indicators, multiple time frame analysis, and a solid risk management strategy, traders can significantly improve their market predictions and trading success.

    The key to mastering demand and supply trading is patience, discipline, and continuous learning. Stay focused, refine your strategies, and keep evolving with the market.

    Stay tuned for more insights on advanced trading techniques in our upcoming blogs!

    PART -1 TECHNICAL ANALYSIS

    PART – 3 TECHNICAL ANALYSIS

    TheHustleSpot

    BUSINESS IDEAS & SIDE HUSTLES

    Designed with WordPress

  • Mastering Candle Formations The Key to Reading Market Trends.

    Part 1 – TECHNICAL ANALYSIS

    Candlestick movements and formations are a crucial tool for traders looking to understand market trends and make informed decisions. Whether you’re a beginner or an experienced trader, mastering candle formations can significantly improve your ability to predict price movements. In this blog, we will explore the fundamentals of candlestick patterns, their types, and how you can use them effectively in your trading strategy.

    The Anatomy of a Candlestick

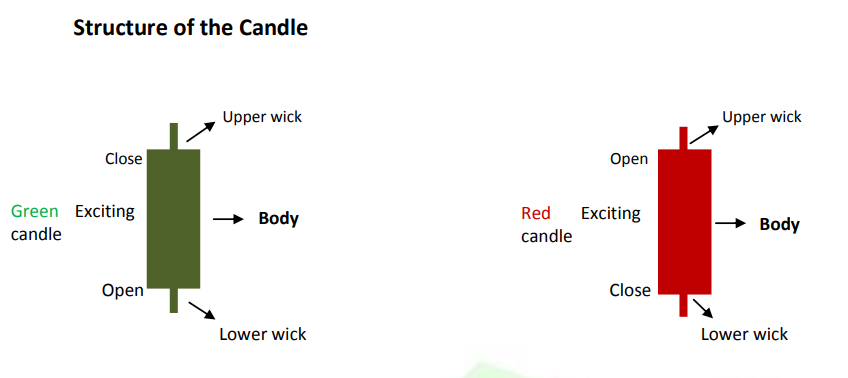
    STRUCTURE OF CANDLE

    Each candlestick encapsulates a specific time frame and provides four essential data points:

    1.Open Price: The initial price at which the asset trades at the start of the time frame.


    2.Close Price: The final price at which the asset trades at the end of the time frame.


    3.High Price: The maximum price reached during the time frame.


    4.Low Price: The minimum price reached during the time frame.


    The body of the candlestick represents the range between the open and close prices, while the wicks (also known as shadows) indicate the high and low prices within the period. A green (or white) body signifies a bullish candle, where the closing price is higher than the opening price, indicating buying pressure. Conversely, a red (or black) body denotes a bearish candle, where the closing price is lower than the opening price, indicating selling pressure.

    Types of candles:

    1.Excitig candles formation :

    -> When the body part of overall candles is more than 50%, the candle is known as Exciting Candle. The body part of the
    candle denotes the strength of the overall candle.

    -> Candle Nos.1 & 3 in above mentioned diagram has more than 50% body of overall candle which makes it Green Exciting
    Candle and Red Exciting Candle respectively.

    -> Candle Nos.2 & 4 in above mentioned diagram has a same structure as candle nos.1 & 3, but has higher body part
    (higher strength) hence, it is known as Green Exciting Strong Candle and Red Exciting Strong Candle respectively.

    EXCITING CANDLES

    2.Base candles formation :

    When the body of overall candle is less than 50%, the candle is known as base candle or we can say no of buyers
    almost equal to no. of seller.

    1. This structure occurs when Buyers are marginally higher than Sellers i.e. 80,000 Buyers / 60,000 Sellers.
    2. This structure occurs when Buyers are marginally higher than Sellers i.e. 80,000 Buyers / 72,000 Sellers.
    3. This structure occurs when Buyers are marginally lower than Sellers i.e. 60,000 Buyers / 80,000 Sellers.
    4. Candle No. 4 reflects very small movement which denotes almost equal number of Buyers and Sellers.
    BASE CANDLES
    EXCITING CANDLES
    BASE CANDLES

    Strength of candles(Demand Zone):

    STRENGTH OF DEMAND ZONES

    Strength of candles(Supply Zone):

    STRENGTH OF SUPPPLY

    Key Candlestick Patterns

    Understanding various candlestick patterns is crucial for anticipating market movements. Here are some fundamental patterns:

    1. Doji
      A Doji occurs when the opening and closing prices are virtually equal, resulting in a very small body. This pattern indicates market indecision, as neither buyers nor sellers have gained control. The significance of a Doji is heightened when it appears after a strong bullish or bearish trend, suggesting a potential reversal.
    2. Hammer and Hanging Man
      Both patterns have a small body with a long lower wick and little to no upper wick.

    Hammer: Appears in a downtrend and signals a potential bullish reversal. The long lower wick indicates that sellers drove prices down during the session, but strong buying pressure pushed prices back up, closing near the opening price.

    Hanging Man: Occurs in an uptrend and suggests a potential bearish reversal. Despite opening higher, the asset experiences significant selling pressure, but buyers manage to push the price back near the opening level. However, the initial sell-off raises concerns about the strength of the uptrend.

    1. Engulfing Patterns
      These are two-candle patterns indicating potential reversals:

    Bullish Engulfing: A small bearish candle is followed by a larger bullish candle that completely engulfs the previous candle’s body. This pattern suggests a shift from selling to buying pressure.

    Bearish Engulfing: A small bullish candle is followed by a larger bearish candle that engulfs the previous candle’s body, indicating a shift from buying to selling pressure.

    1. Morning Star and Evening Star
      These are three-candle patterns signaling potential trend reversals:

    Morning Star: Consists of a long bearish candle, followed by a short-bodied candle (which can be bullish or bearish) that gaps down, and then a long bullish candle that closes above the midpoint of the first candle. This pattern indicates a transition from a downtrend to an uptrend.

    Evening Star: Comprises a long bullish candle, followed by a short-bodied candle that gaps up, and then a long bearish candle closing below the midpoint of the first candle. This pattern signals a potential reversal from an uptrend to a downtrend.

    Implementing Candlestick Patterns in Trading
    To effectively incorporate candlestick patterns into your trading strategy:

    Combine with Other Technical Indicators: While candlestick patterns provide valuable insights, their reliability increases when used alongside indicators such as Moving Averages, Relative Strength Index (RSI), or the Moving Average Convergence Divergence (MACD). For instance, a bullish pattern confirmed by an RSI below 30 can strengthen the signal of an impending upward move.

    Analyze Support and Resistance Levels: Identifying key support and resistance zones enhances the effectiveness of candlestick patterns. A bullish reversal pattern near a significant support level may indicate a strong buying opportunity.

    Assess Trading Volume: Volume acts as a confirmation tool. A pattern accompanied by high trading volume is more likely to result in the anticipated price movement.

    Consider Multiple Time Frames: Examining candlestick patterns across various time frames provides a comprehensive view of market dynamics. A pattern observed on a higher time frame may carry more weight than one on a lower time frame.

    Common Pitfalls to Avoid :

    Overlooking Market Context: Always consider the broader market environment. A pattern may have different implications depending on prevailing market conditions.

    Relying Solely on Candlestick Patterns: Avoid making trading decisions based solely on candlestick patterns. Integrate other forms of analysis to confirm signals.

    Neglecting Risk Management: Implementing proper risk management strategies, such as setting stop-loss orders, is crucial to protect against unexpected market movements.

    Conclusion

    Give more importance to the data in highlighted part, patterns that are mentioned in this article are not important at all , you can ignore them and just focus on the candlesticks study that is the most important part for learning. Continuous learning and practice are essential to effectively apply candlestick analysis in real-world trading scenarios.Stay tuned for more deep technical analysis of the candles and I can say that you will be profitable in the coming future if you follow these stratigies . Let us know in the comments if you have any doubts and querries!!

    PART – 2 TECHNICAL ANALYSIS

    TheHustleSpot

    BUSINESS IDEAS & SIDE HUSTLES

    Designed with WordPress