Introduction
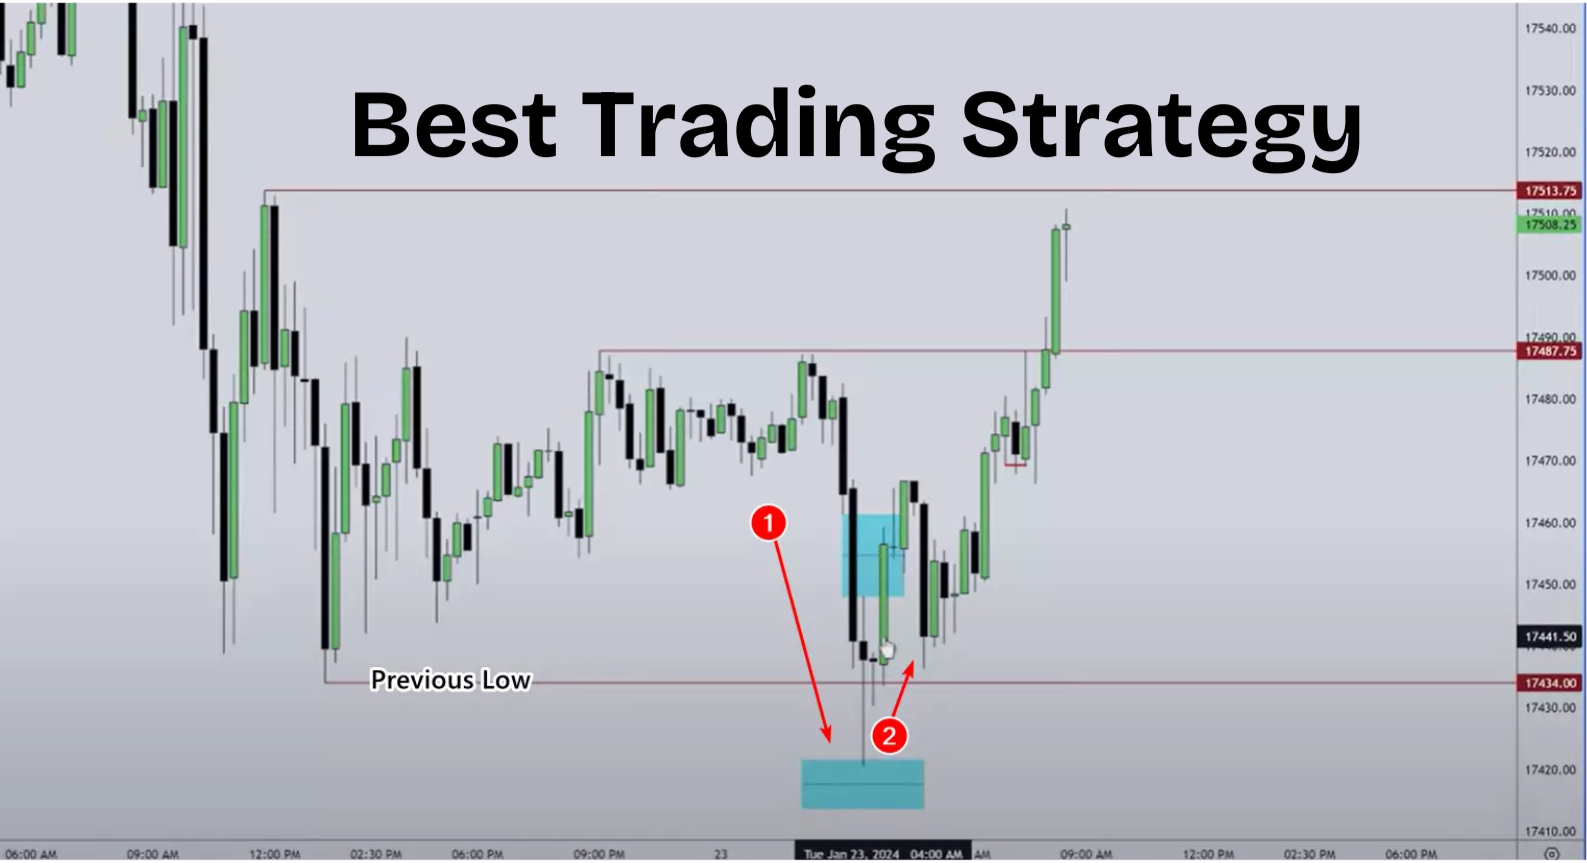
If you haven’t explored my free course on Technical Analysis yet, I highly recommend going through it to gain in-depth knowledge. This Blog will help you understand how to effectively use Demand Zones and Supply Zones for executing winning trades. This is one of the best trading strategy out there. In this article, I will demonstrate the Top-Down Approach with an example and also touch upon key points of Fundamental Analysis.
What is the Top-Down Approach?
The Top-Down Approach involves analyzing a stock or asset from a higher time frame to a lower time frame while marking all the zones (Demand or Supply) across different time frames. If smaller zones align within larger zones, the confidence in the trade increases significantly.
Important Points:
- The closing of the Demand or Supply zone should be strong.
- If the zone includes the EMA-20 (Exponential Moving Average) of any time frame larger than 4 hours (i.e., Daily, Monthly, 3-Month, 6-Month, or 12-Month), the trade gains additional reliability.
- The Demand or Supply zone should be fresh. A tested zone is less reliable since pending orders in that zone reduce after the first test.
- If the zone includes a Golden or Death Crossover, it further strengthens the trade setup.
Steps to Mark Zones from Top to Bottom
Let’s take the example of TATA MOTORS to illustrate this approach. The Technical Analysis is done on Trading View.
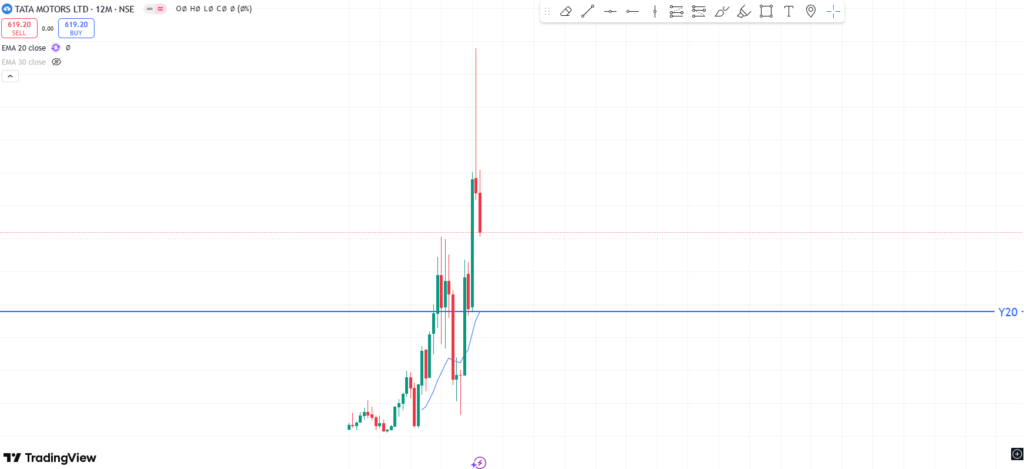
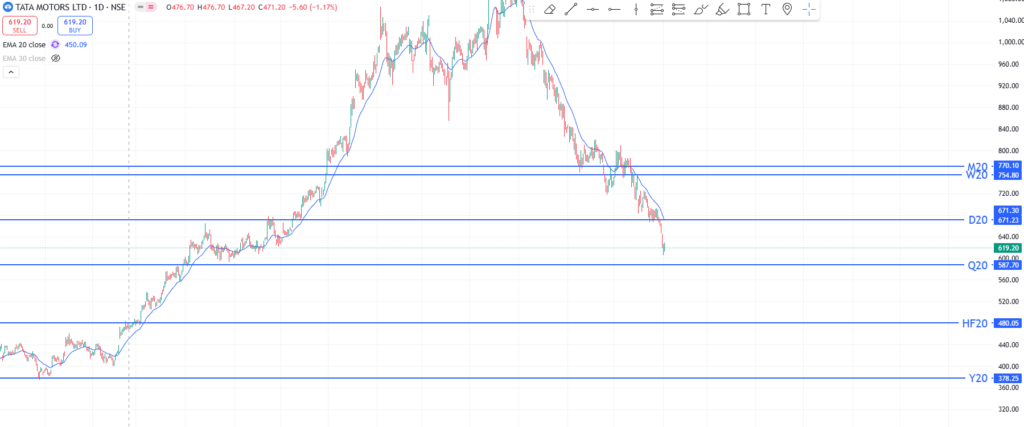
Step 1: Marking EMA-20 Levels
Identify the EMA-20 on multiple time frames: Daily, Weekly, Monthly, Quarterly, Half-Yearly, and Yearly.
Step 2: Identifying Fresh Demand Zones
Yearly Demand Zone :
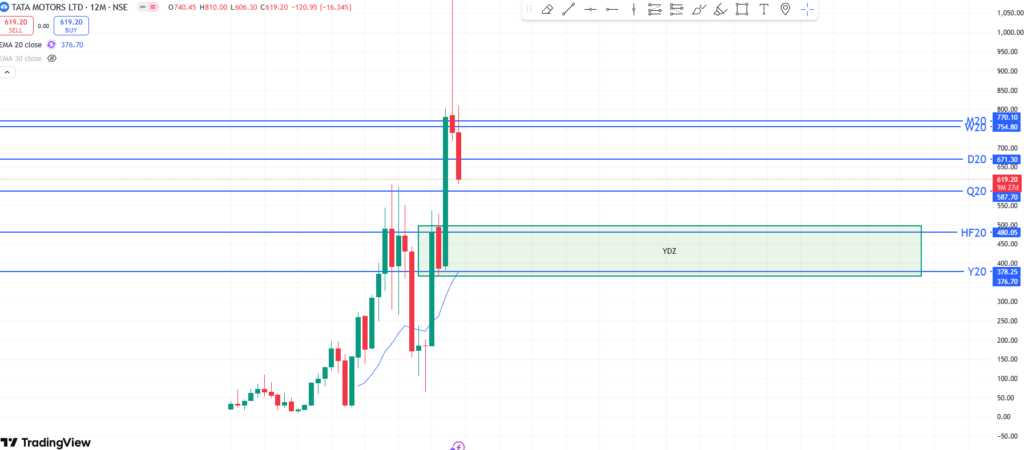
- Start with the 12-Month time frame and mark all fresh Demand Zones.
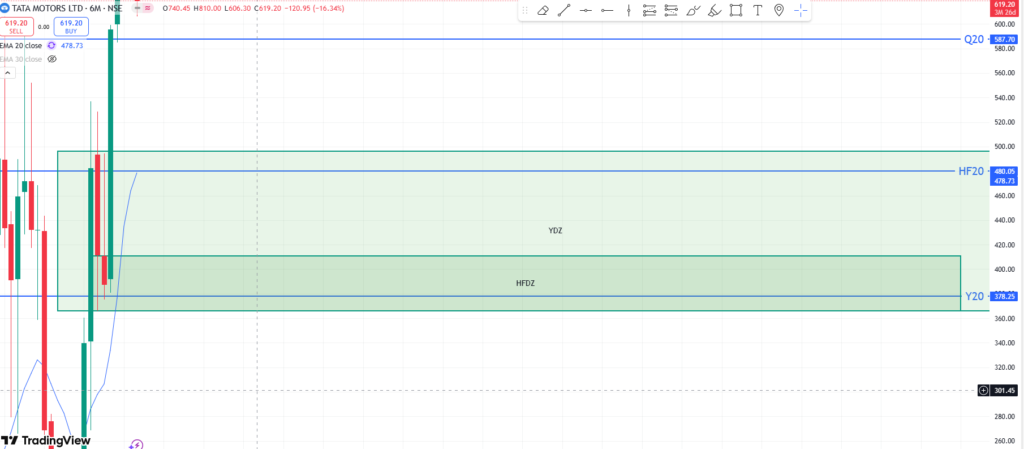
- Begin with the yearly time frame (where one candle represents a full year) and gradually shift to shorter time frames to mark fresh Demand Zones.
Half-Yearly Demand Zone :
Quarterly Demand Zone :
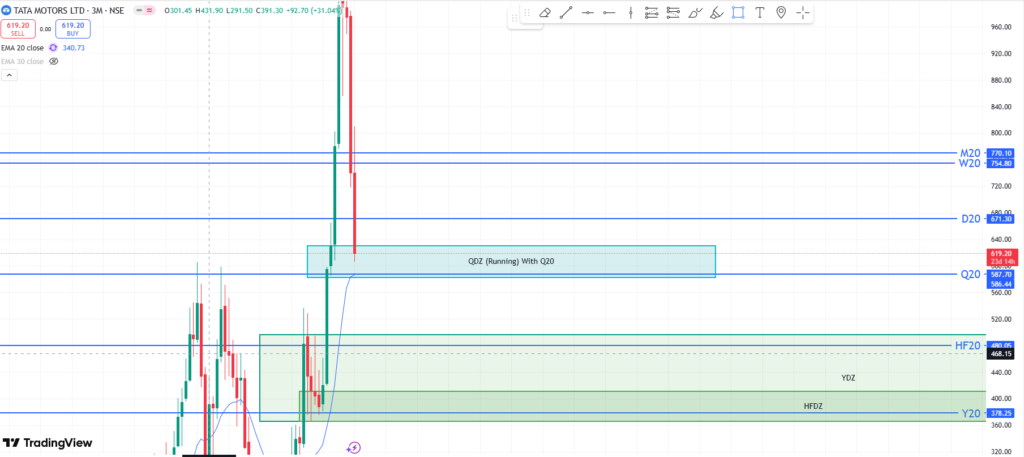
Monthly Demand Zone :
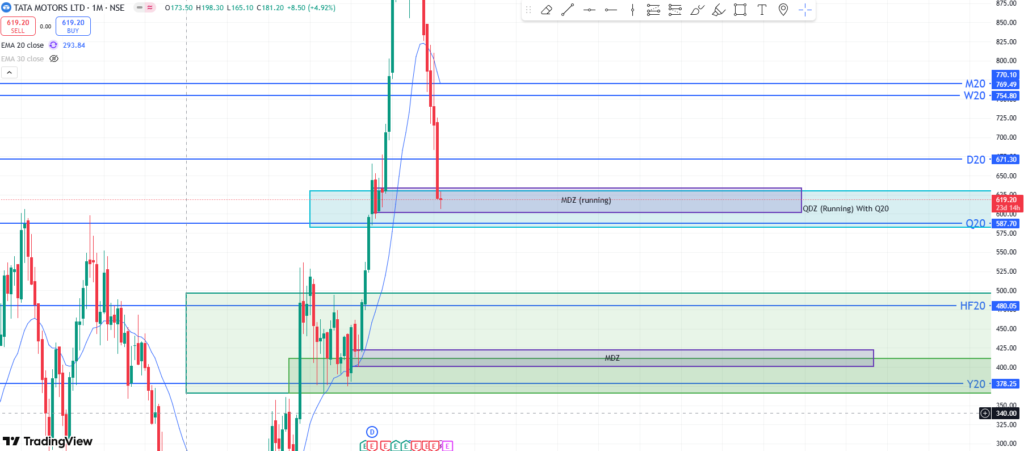
Step 3: Stopping at a High Trade Score Zone
Best Monthly Demand Zone (small points zone) :

- Once a smaller zone with a strong trade score is identified, stop marking further zones.
- A good smaller zone can appear even on a higher time frame. In this example, the Monthly Time Frame provides the best trade zone.
Running Monthly Demand Zone :
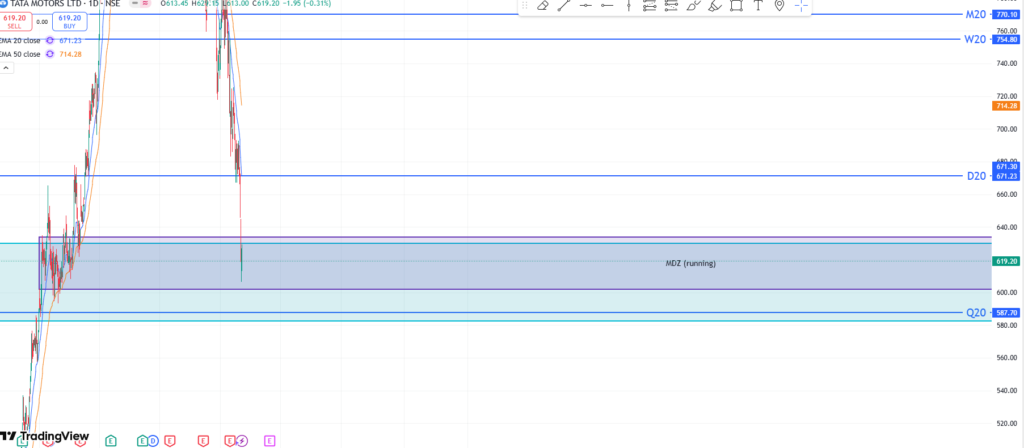
Step 4: Identifying Crossovers
- Mark any Golden Crossovers or Death Crossovers present.
- In our example, two Golden Crossovers were found, with one aligning with the Monthly Demand Zone, strengthening the trade setup.
Perfect MDZ with GOLDEN CROSSOVER :
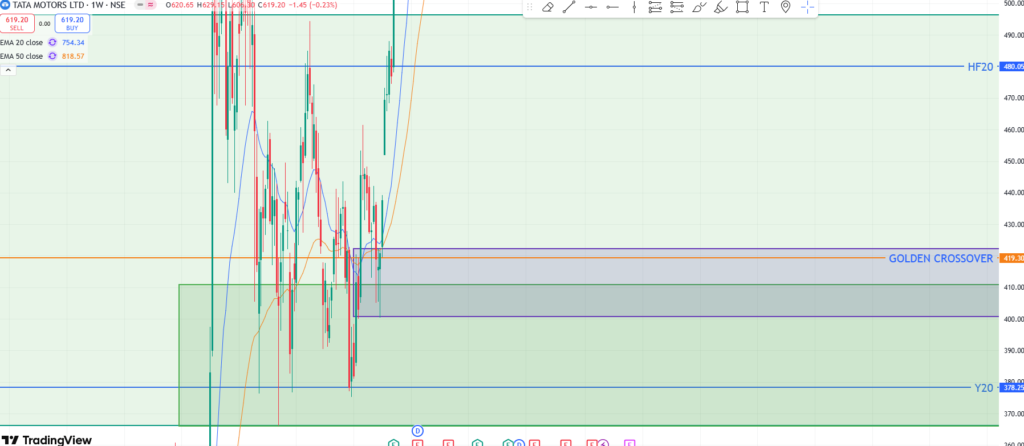
Step 5: Entering the Trade
- Wait for the price to enter the marked zone.
- Once the price reaches the zone, choose your entry strategy and execute the trade.
Confirmation Entry: Two Steps Ahead
When the price enters a higher time frame Demand Zone, switch to the Daily time frame:
- If a smaller Demand Zone forms within the bigger Demand Zone and breaks one Daily Supply Zone, take an entry on that Demand Zone.
- Synchronize lower time frame Demand Zones of the sector with higher time frame Demand Zones of shares for better trade accuracy.
- If the price rises slowly and forms a Demand Zone on a higher time frame, expect a sudden drop back into the bigger time frame Demand Zone before bouncing back.
When to be Aggressive vs. Conservative
Conservative Approach
- If a stock price moves from a higher time frame Demand or Supply Zone, ignore smaller time frame opposite zones.
- If a stock breaks a higher time frame Supply Zone and reaches an all-time high, it indicates bullish momentum. Trade using smaller Demand Zones.
- If the price hits a higher time frame Supply Zone, shift to a conservative approach.
- If the price closes above the higher time frame Supply Zone, shift to an aggressive approach.
- If the price moves from a Monthly Supply Zone without strong closing, trade conservatively on the Monthly Demand Zone.
How to Analyze Fundamentals
IT Companies
- Revenue Guidance (expected percentage growth)
- Accenture’s results (as a benchmark)
Banking Companies
- NPA (Non-Performing Assets)
- Interest Margins
- Slippages
Cement Companies
- Quarterly Profit Margins
- Expansion of Plants
Chemical Companies
- Profit Margins
Reliance
- Revenue generated from Petrochemicals
- Growth (Quarterly and Yearly)
Pharmaceutical Companies
- FDA Inspections
- Profits
FMCG Companies
- Volume Growth
- Profits
Metals Industry
- Industry Demand Trends
- Profit Margins
Conclusion
The Top-Down Approach is a powerful strategy for identifying high-probability trades by aligning Demand and Supply Zones across multiple time frames. By incorporating technical analysis with fundamental insights, traders can enhance their decision-making and increase their chances of success. Use this method wisely and always prioritize risk management in your trades!
Leave a Reply